#China; #HighResolutionCottonMaps; #Xinjiang; #CottonProduction; #CottonExtraction
Scientists from the Aerospace Information Research Institute (AIR) of the Chinese Academy of Sciences (CAS), together with collaborators from Shihezi University (Xinjiang, China) and University of Toronto (Toronto, Canada), have proposed a cotton mapping strategy and provided high-resolution cotton maps throughout Xinjiang Uygur Autonomous Region, China, https://phys.org/news/2023 reported
This study was published in Scientific Data on Oct. 10.
Xinjiang is the leading and largest cotton production region in China and has accounted for more than 80% and about 20% of cotton production in China and the world, respectively. Accurate and detailed mapping of cotton in Xinjiang is vital for cotton management, disease prevention and control, and yield forecast.
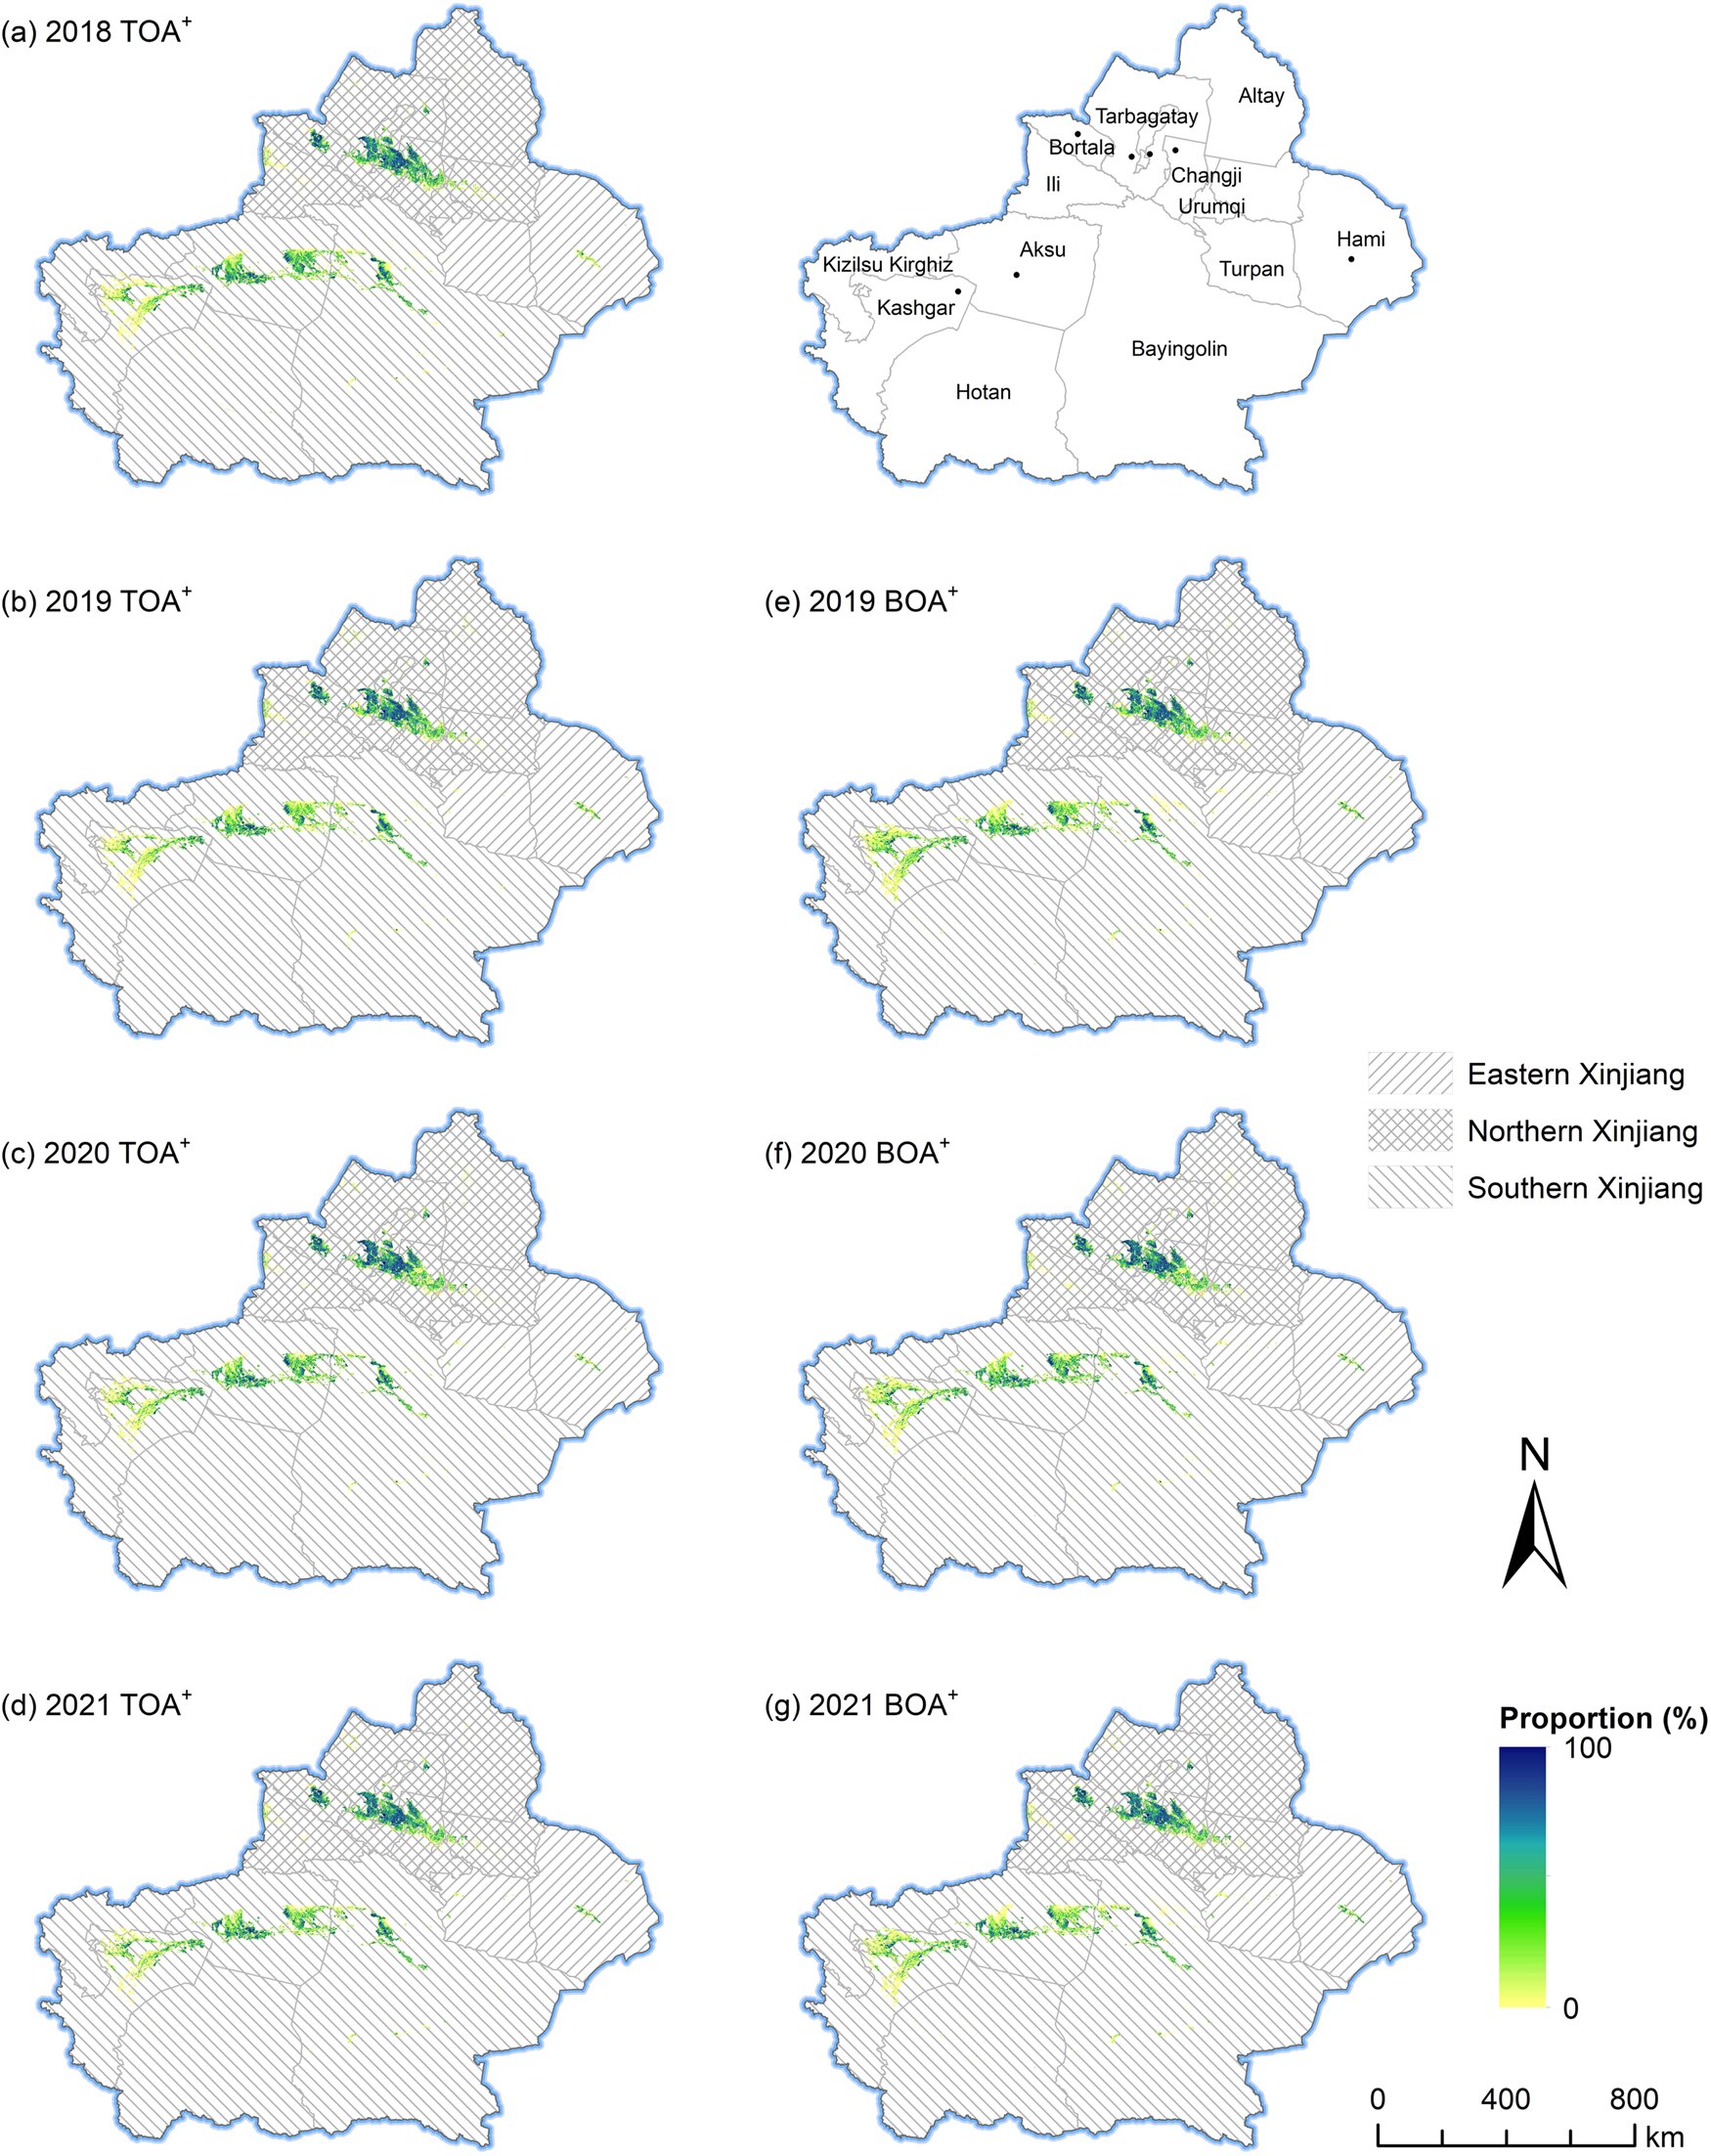
The team employed a two-step mapping strategy, i.e., cropland mapping followed by cotton extraction, to produce cotton maps (10 m) of Xinjiang (XJ_COTTON10) from 2018 to 2021.
To address the high heterogeneity, they used multi-source remote sensing data, including the optical remote sensing imagery and the synthetic aperture radar imagery, to extract spectral, textural, structural, and phenological features. They also deployed auxiliary data such as topographic and meteorological variables.
The results showed that the cotton/non-cotton classification model achieved overall accuracies of about 95% and 90% on the test samples of the same and adjacent years, respectively. The proposed two-step cotton mapping strategy proved promising and effective in producing multi-year and consistent cotton maps. XJ_COTTON10 agreed well with the statistical areas of cotton at the county level.