With recent extreme weather events happening in Aotearoa New Zealand and internationally, new research published in Nature Geoscience aims to improve predictions of heavy rainfall and provide the public with earlier warnings so they can prepare for extreme weather events.
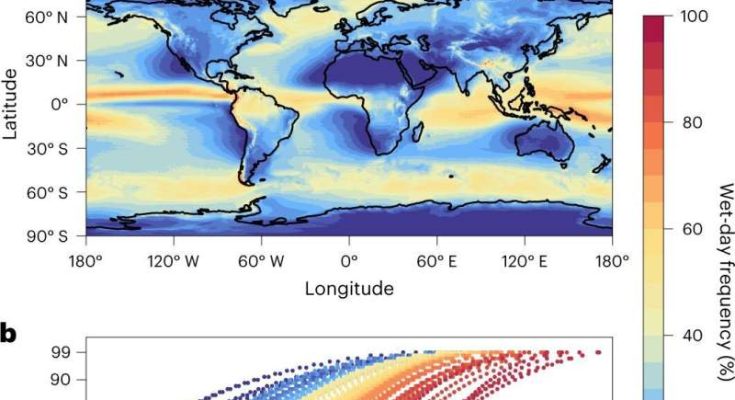
UC Ph.D. student Cameron McErlich used a range of models and satellite observations to examine daily rainfall. “Through the research we discovered that if you know how often it rains annually in one place you can make a strong prediction of the size and likelihood of extreme rainfall in that place.”
“By watching changes in rainfall occurrence, we can use our findings to understand regions where extremes might change. The findings are important, because currently weather and climate research treats these things separately.
“We all know the old adage ‘When it rains, it pours.’ Previously, we haven’t been able to verify that information as weather stations are not well-distributed, especially over the ocean. But this research gives us that verification and we can show that the phrase is actually accurate.”
Supervised by UC Professor Adrian McDonald and Victoria University of Wellington Professor James Renwick, McErlich’s research also identifies there are similar underlying processes globally for areas that see frequent high rainfall.
The research has important implications for how rainfall patterns might change, and where extreme rainfall occurs. “One of our results is that as long as you know how often it rains every year in a location, you can make a really good first guess of the size of extreme rainfall,” McErlich says.
“It also provides a new way to view changes in intensity and frequency of rainfall in an integrated way which should help to better understand climate projections of future rainfall.
“For places like New Zealand, which see very different rainfall patterns on the East and West Coast, it suggests that we need to think about these regions differently.”
Not only is the research important for New Zealand but it will also be important globally, he says, as climate change influences the frequency and intensity of extreme weather events.
#ClimateChange; #WeatherStations; #ClimateChange; #ExtremeWeatherEvents


